Metrics as a thermometer for IT business
Big systems require constant analysis and monitoring, especially when tasks change rapidly. Metrics help to monitor all processes to respond in time to system load and make the necessary changes. Metrics should be used when we need to analyze systems and processes' health. When we know the root of the problem, we will understand how to manage it. The best practices in IT technologies prove that the use of metrics helps speed up the release, not slow it down. Analyzing metrics will help you find the problem and fix it quickly, and not waste your time on it in the future.
What are metrics?
IT metrics are quantifiable measurements used by IT leaders to help manage the business of IT. They help CIOs or Heads of IT understand the value of technology and demonstrate the value of IT to the rest of the business.
So, the metric is an indicator of the current state of goal achievement. Metrics without a goal, just for the sake of measuring something, have no sense.
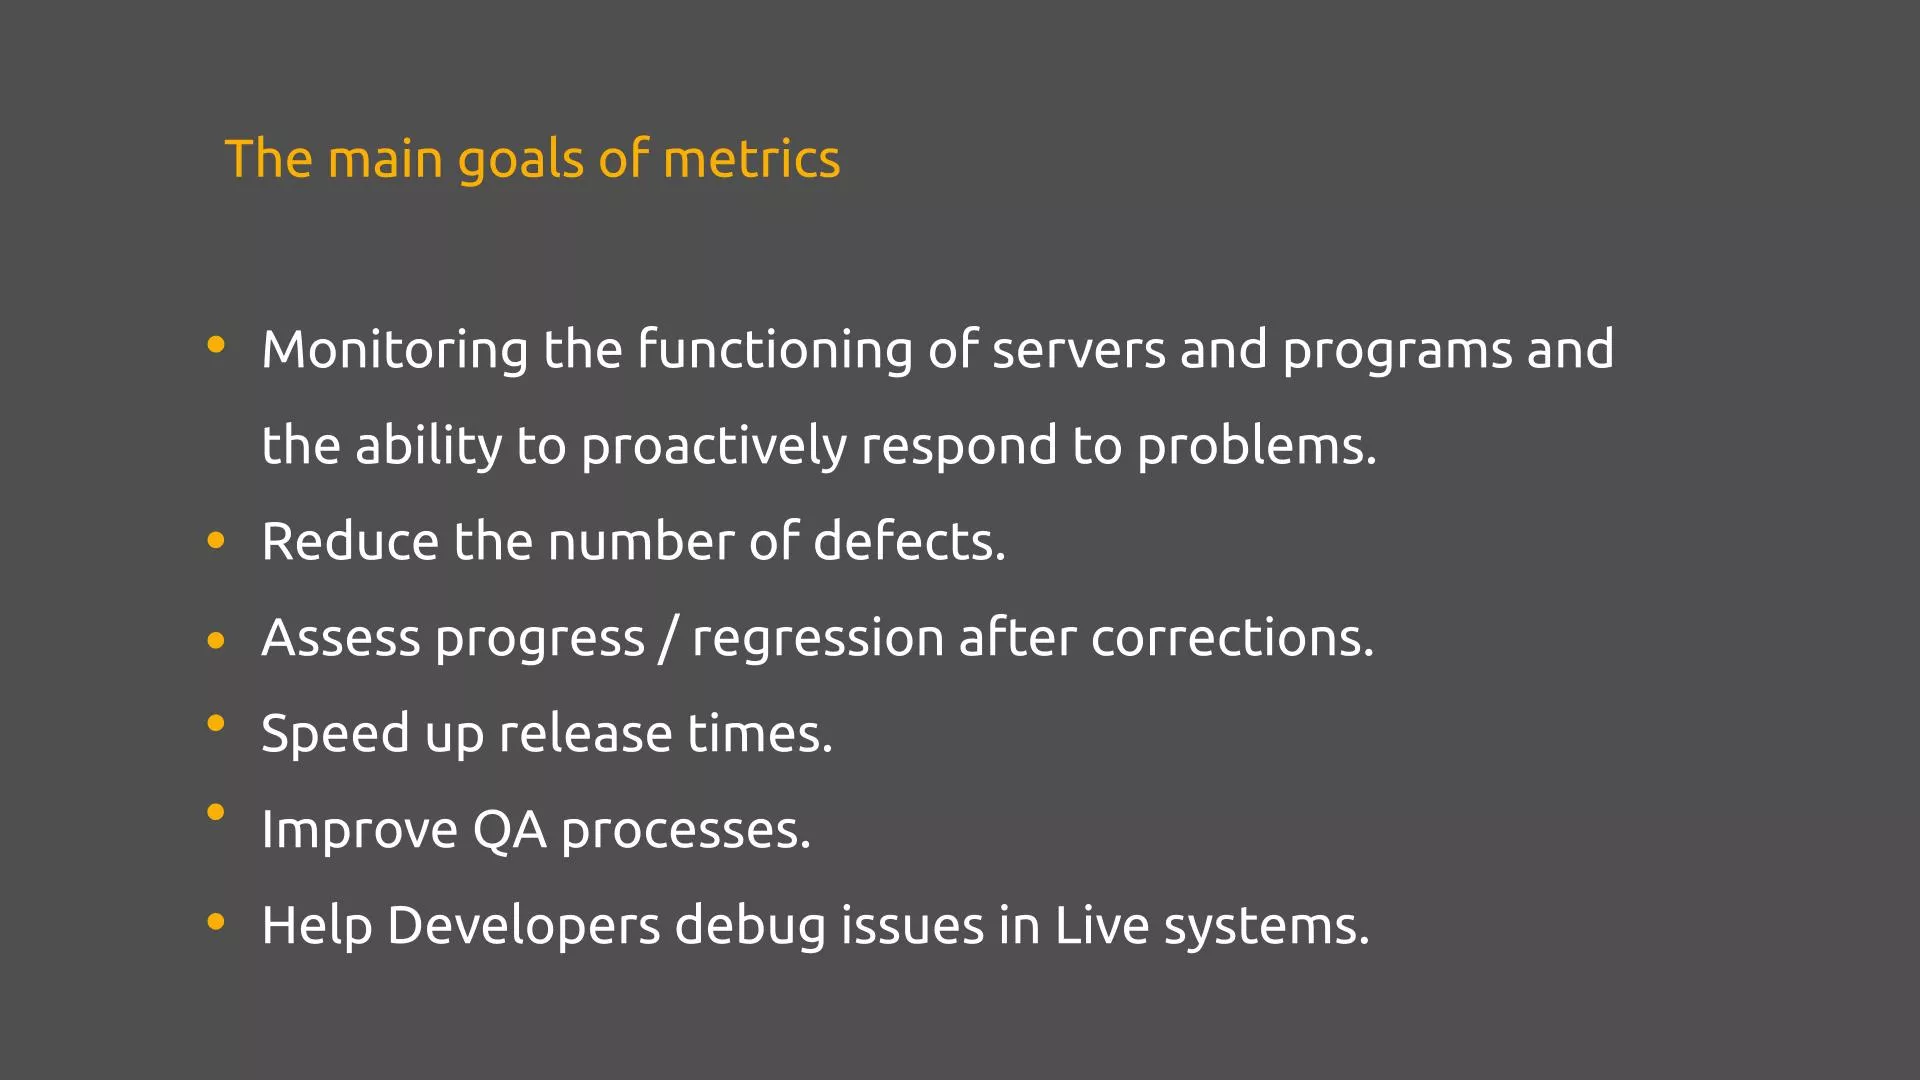
Sites work on servers, so monitoring server performance is a priority task for site maintenance. Servers are often overloaded, and errors appear one after another. Metrics can show all this to the team. And notify the teams about issues proactively.
A server log is a log file (or several files) automatically created and maintained by a server consisting of a list of activities it performed.
How do metrics work?
Different programs are used to collect data on servers. TIG Stack — Powerful monitoring tool with a detailed Dashboard. TIG Stack stand for Telegraf, InfluxDB, and Grafana.
Telegraf takes up not that much memory space and can collect a large amount of information from the server.
Telegraf is a server-based agent for collecting and sending all metrics and events from databases, systems, and IoT sensors.
Telegraph can take information from the server and send it to a centralized system (InfluxDB). But for these metrics to be clear to all team members, they need to be visualized. In addition, metric data is dynamic. That is, the information is updated every second. So it is very convenient to have filters for all kinds of information.
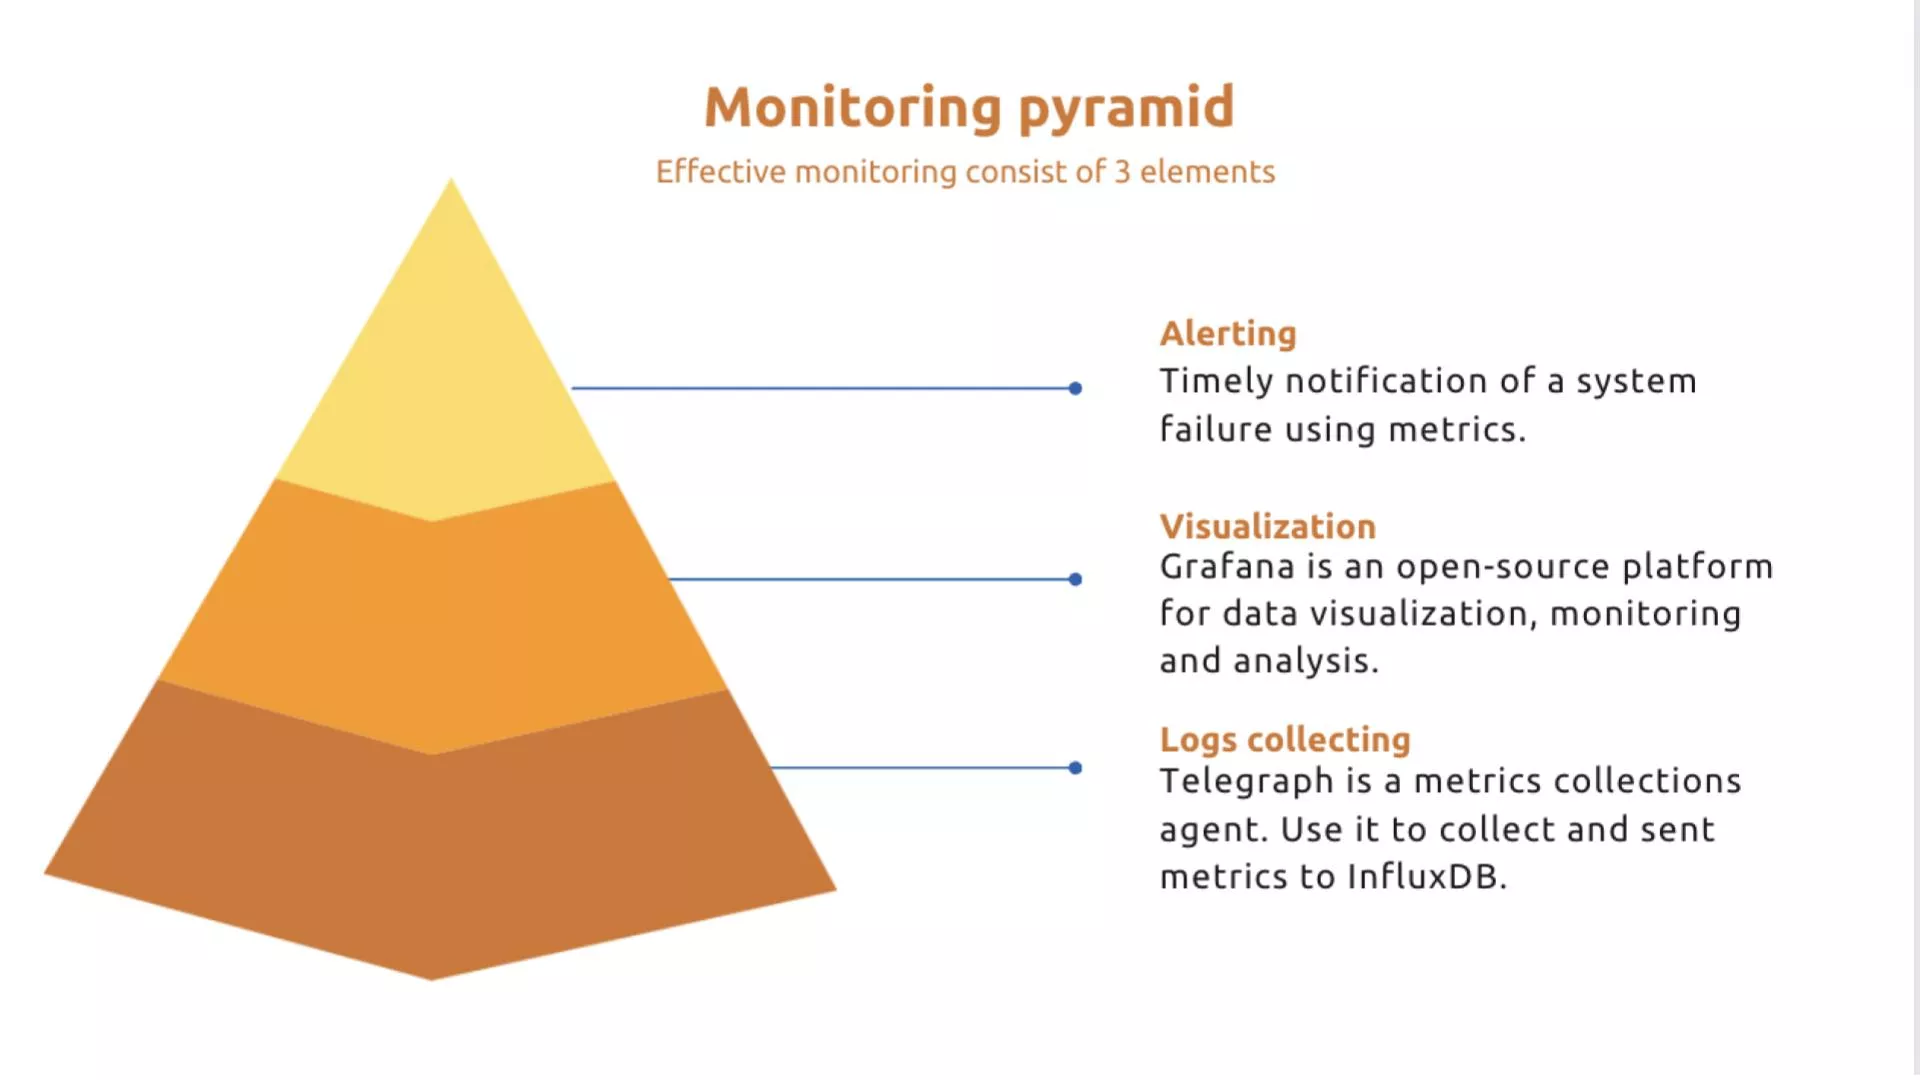
Grafana can be used to centralize the analysis, visualization, and alerting for all of the data. It’s very good for users who prefer to set up, administer, and maintain their installation.
Grafana can offer:
- Unify your data, not database
- Data everyone can see
- Flexibility and versatility
- Dashboards that anyone can use
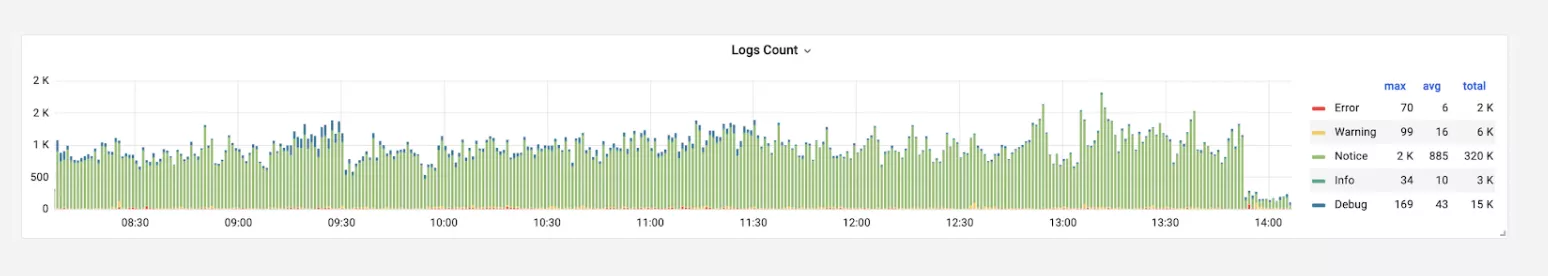
Filters in Grafana allow you to select the time and types of notifications to be analyzed. This is very convenient because you don't need to analyze the whole table when you can choose a clear period. For example, the last 15 minutes.
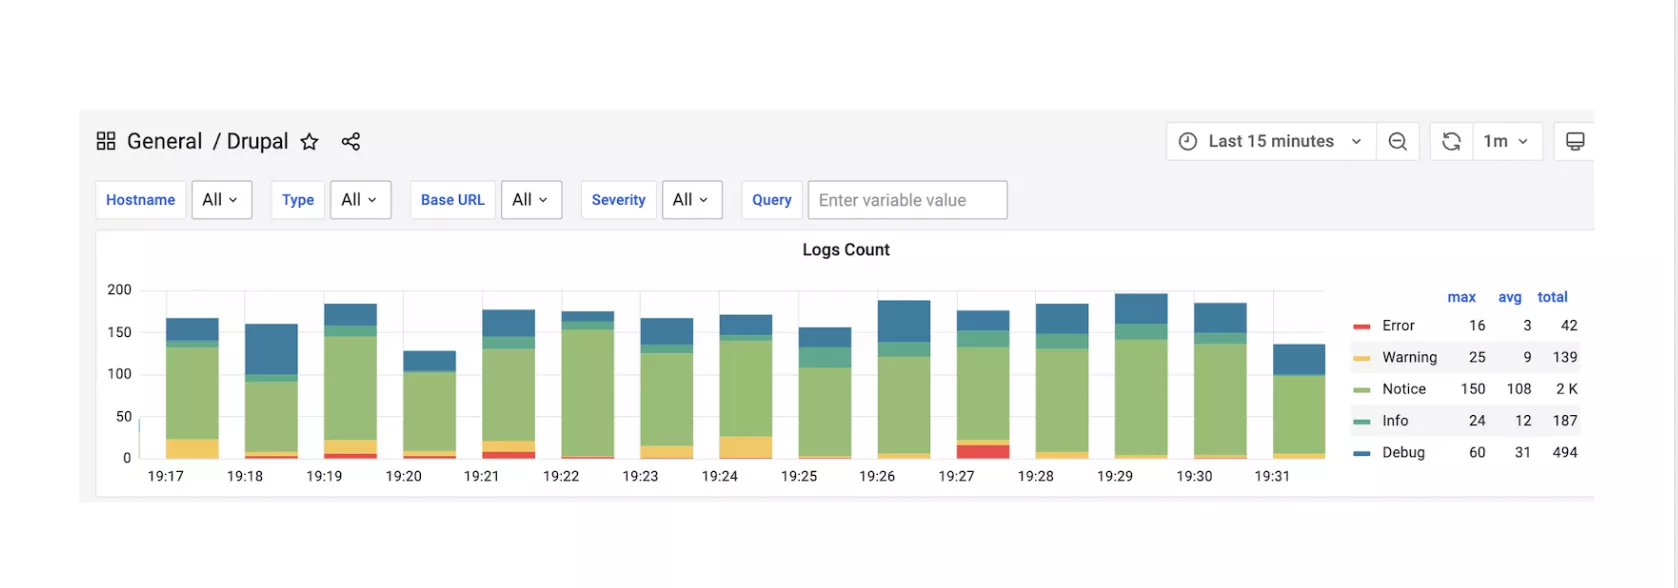
To understand how to act, you need to find among many types of logs exactly those that currently need monitoring. These can be notifications about errors, warnings, or others that can be chosen by filters.
Top issues that metrics help prevent and resolve (real examples)
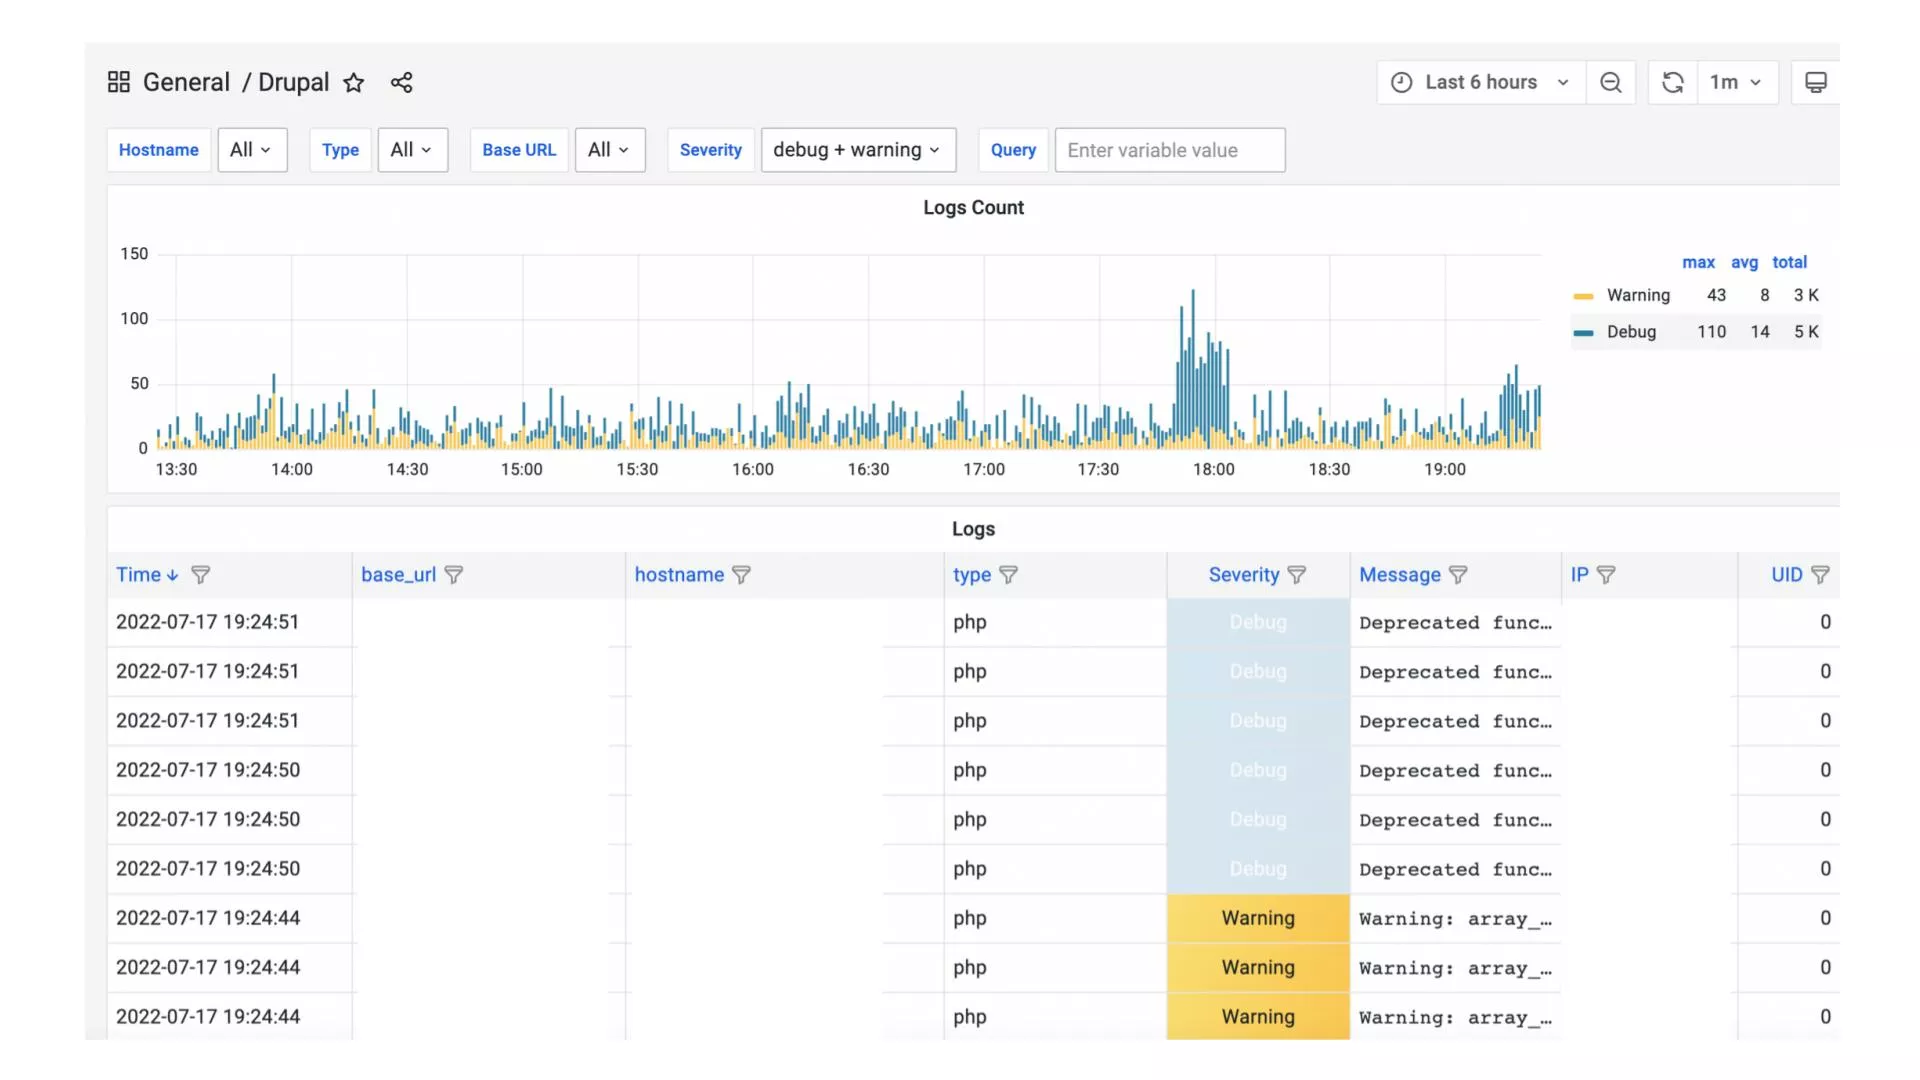
If the system works well, then the graph of metrics is stable, or with small deviations from the norm. But if the system fails, the graph shows it immediately.
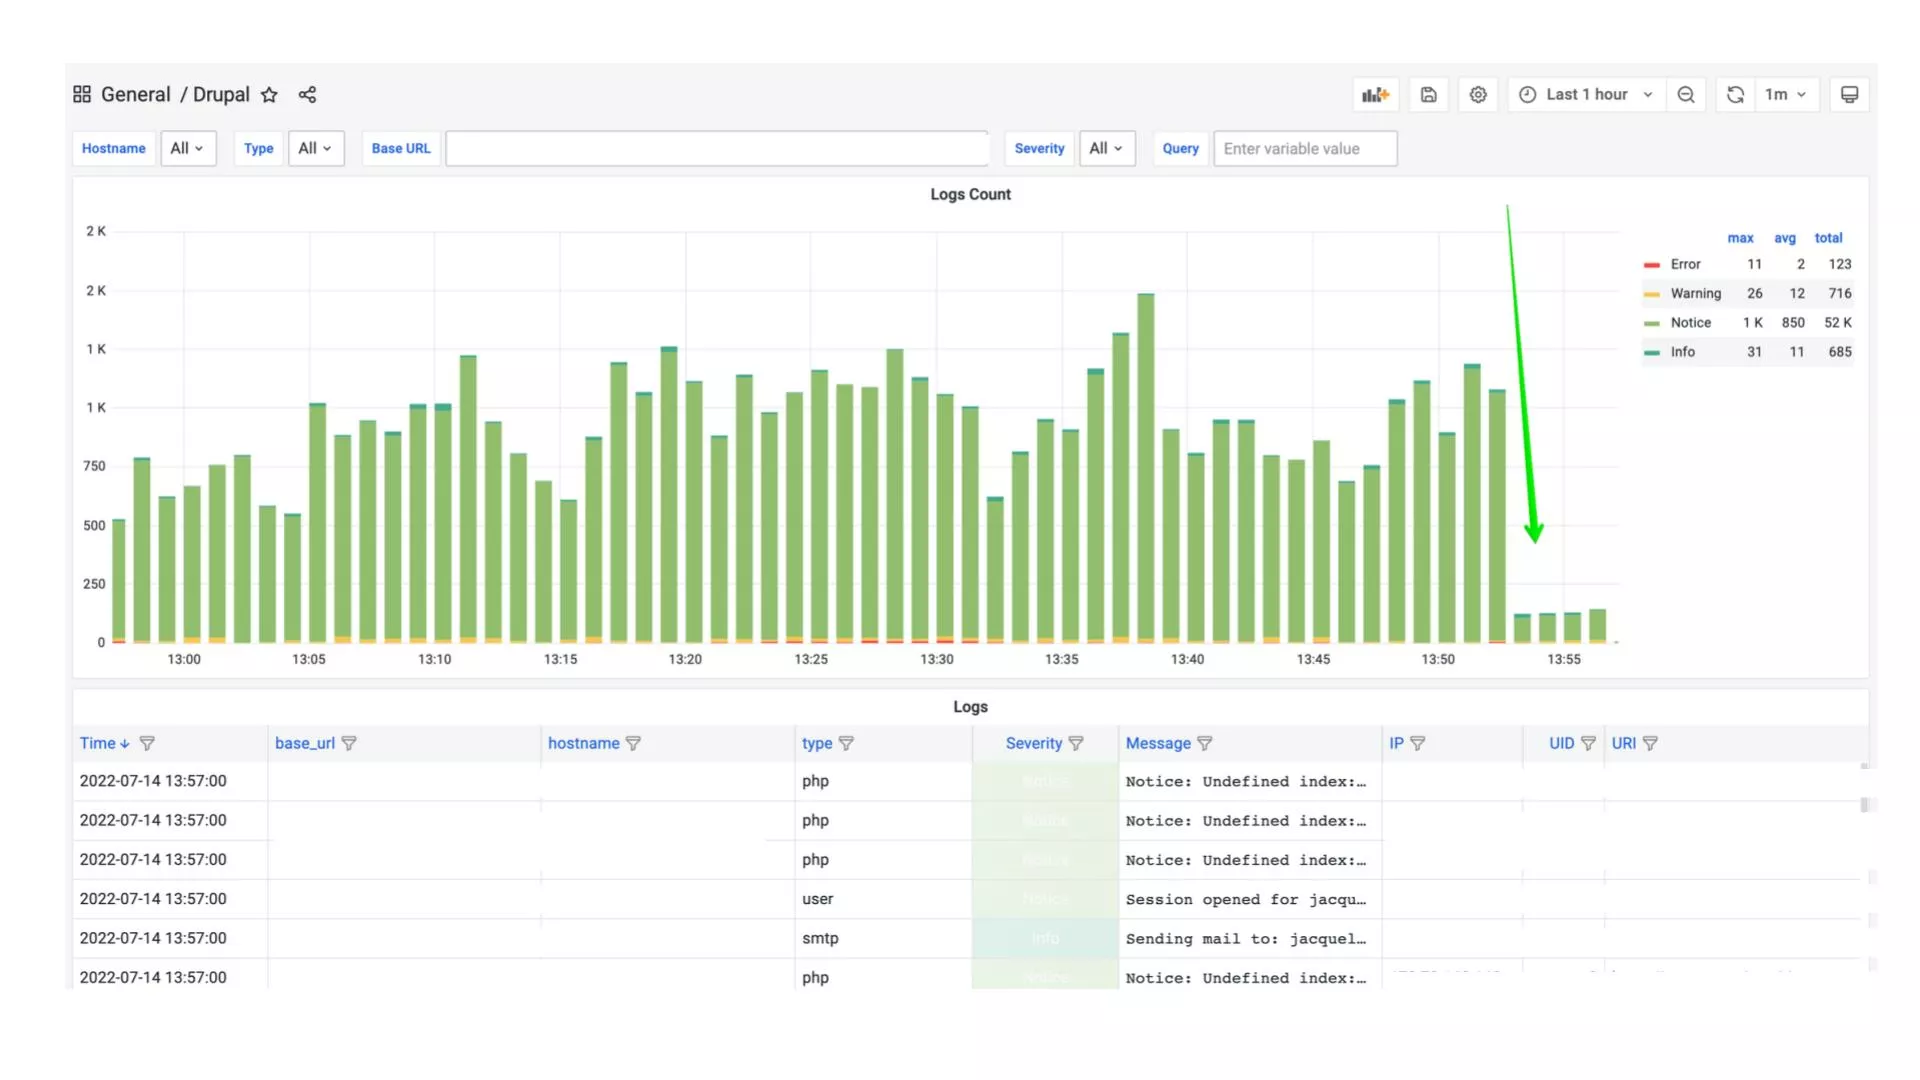
This graph shows that the log count sometimes exceeded 2000 messages per 1 minute. Among these messages were those that reported errors or system failures.
The team, which monitored these processes by metrics, was able to find out the cause of the errors and develop code to eliminate them. As soon as the code deployment was done, the schedule changed and the number of logs decreased, which is very important for the operation of the servers and the site in particular.
Code updates usually start with Development. When everything is ready, QA joins the testing. If bugs appear, the code is refined and deployed. And if bugs appear again after deployment, they affect the business and the end user.
Of course, end users can write feedback and bugs will be fixed during the next release. But is it worth going through this circle again and again if there is another option?
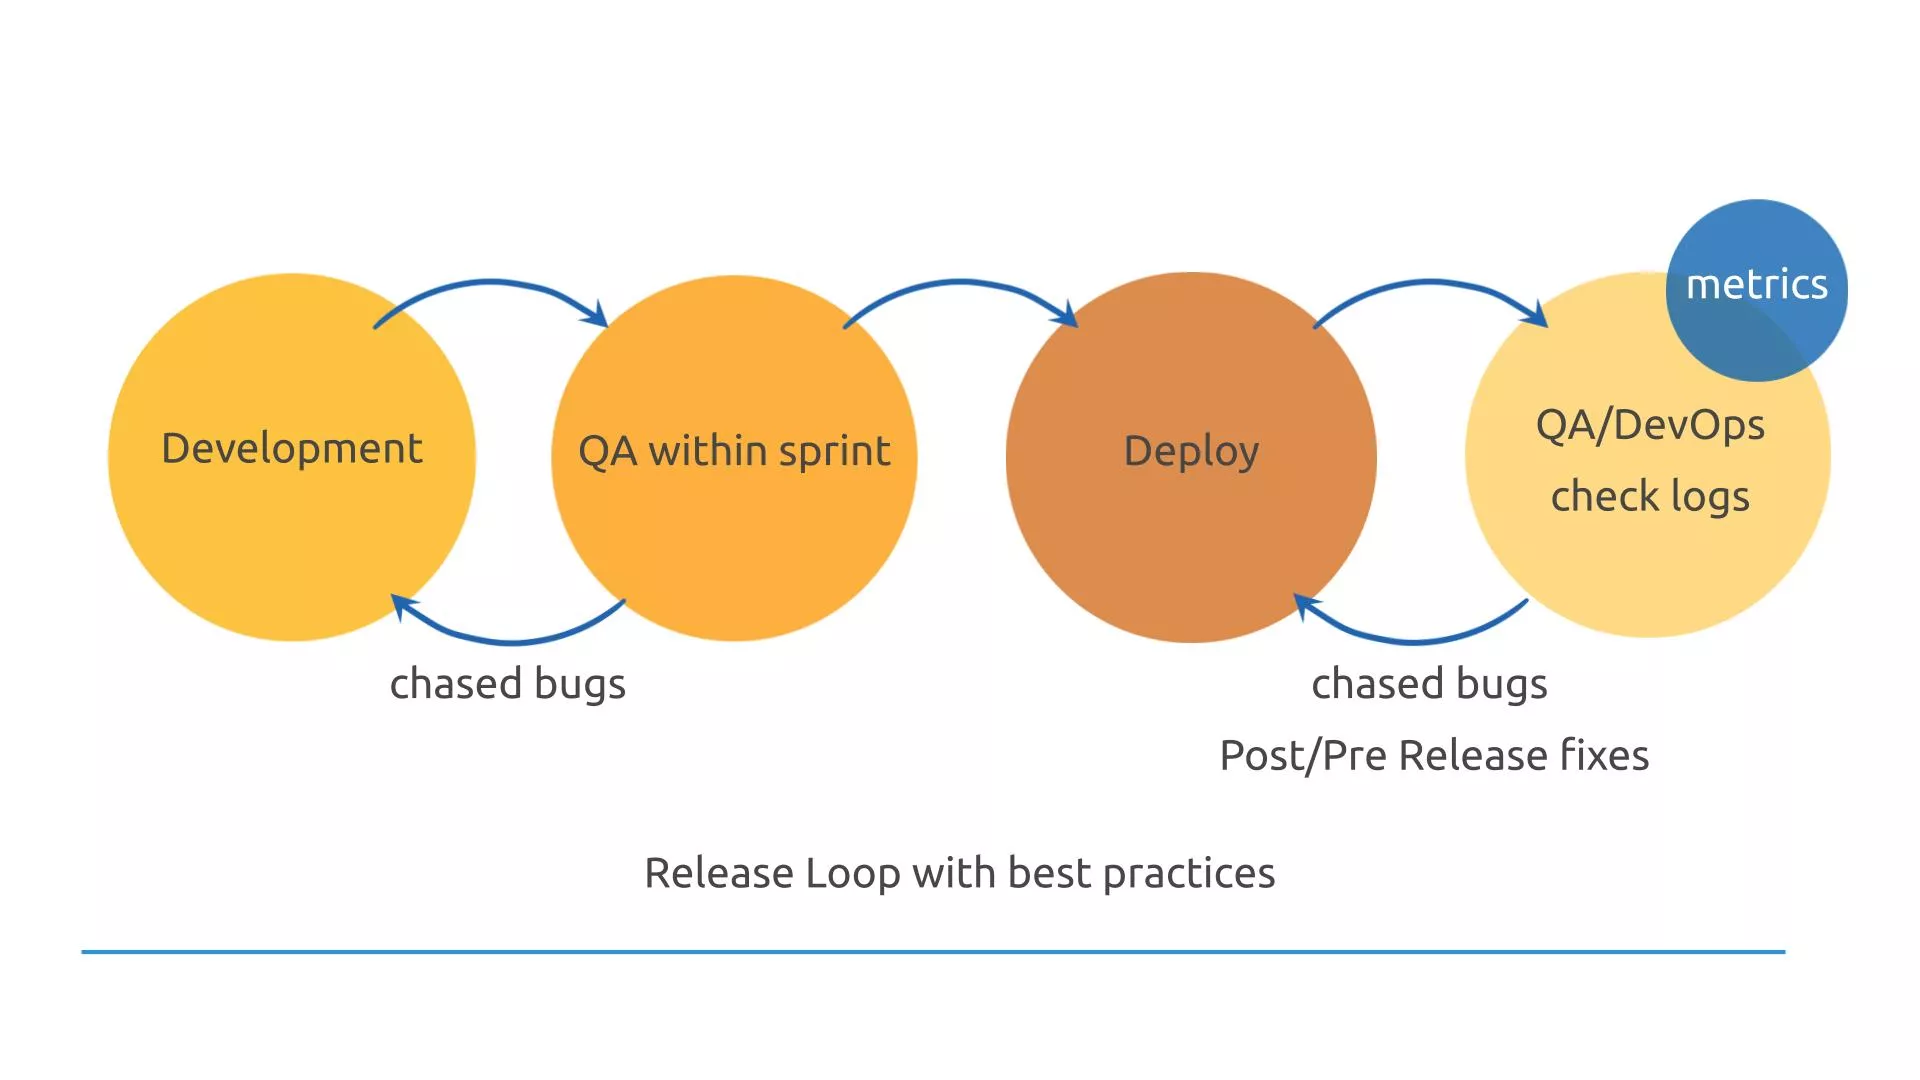
Best practices for using metrics show that everything can be tested in parallel with the production branch before deploying updates. QA and DevOps can check logs by metrics and add Pre Release fixes. Such a simple scheme, but so important for business.
Before deployment 500-2000 messages per minute, after deployment 50-200 messages per minute.
Metrics for IT business
We are convinced that metrics play an important role in the IT business because they are able not only to detect a problem in time but also to warn about it, to find the cause and the desired solution.
In addition, correctly configured metrics can show the weak points, and predict the next actions. Metrics visualize processes, and clearly show problems and business needs.
Here's a simple example of how metrics work.
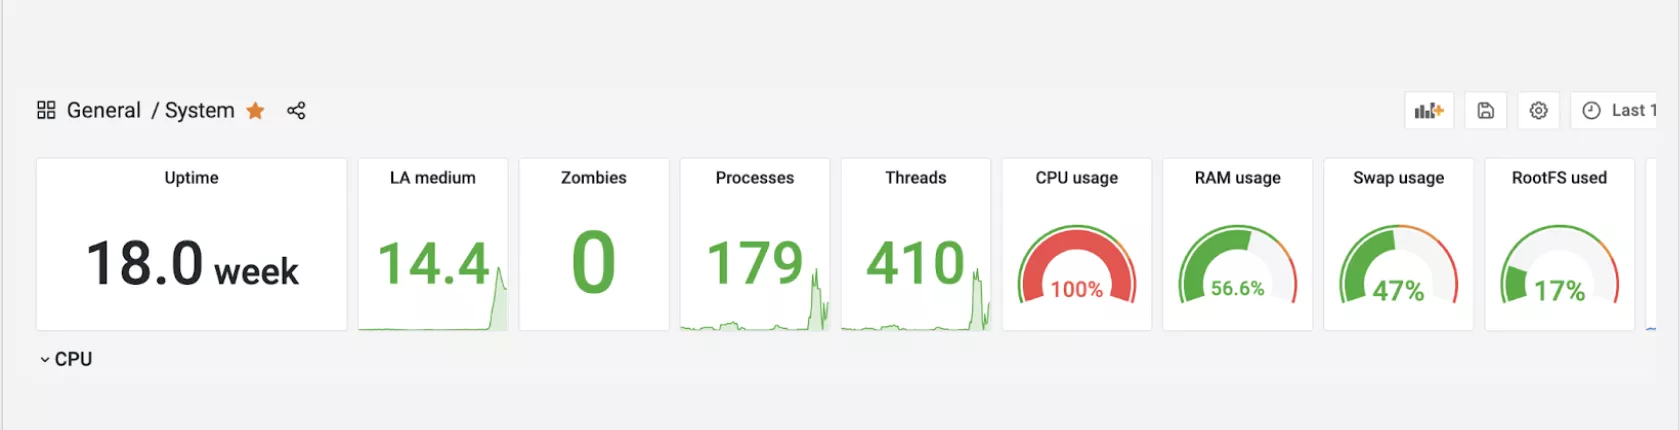
Metrics help to see the load on the processor during deployment and take the necessary measures in time.
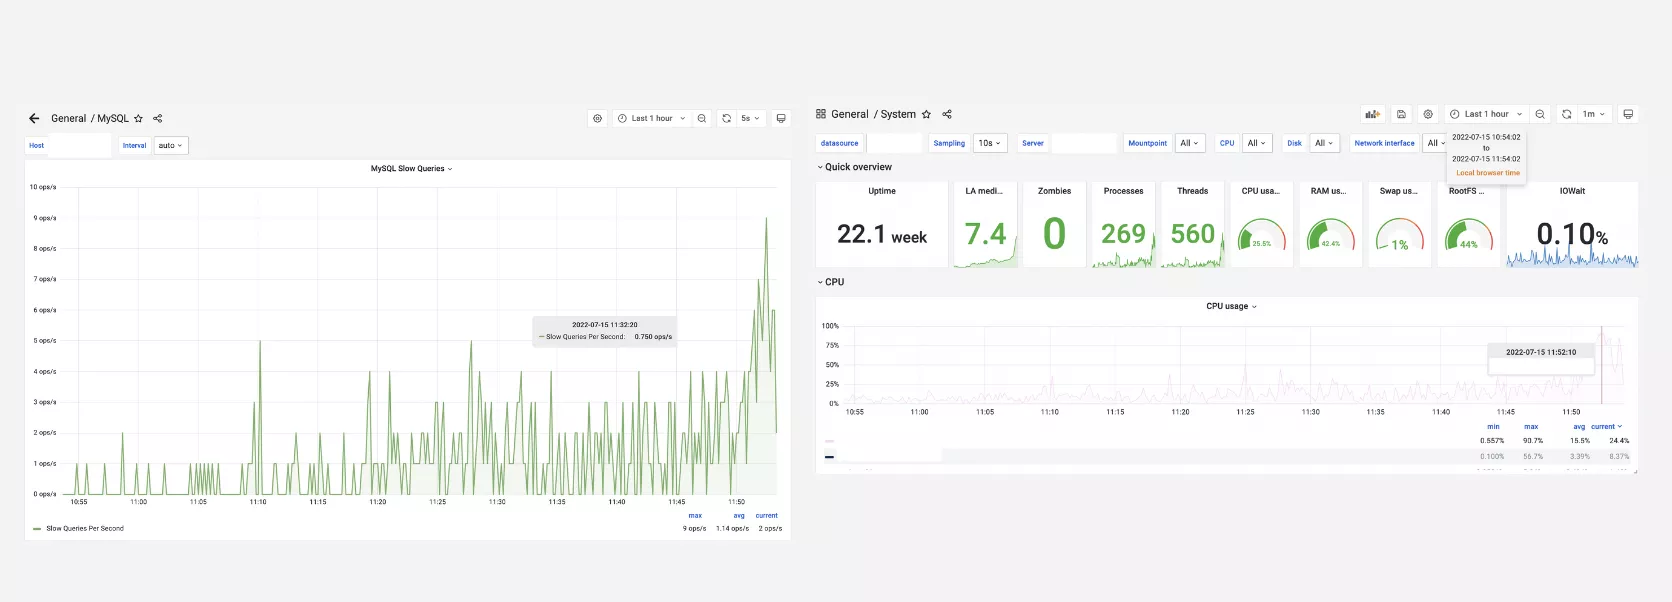
SQL slow queries -> high CPU usage means, that the site can be slowed down.
If the system is sick, the metrics will tell you about it. Metrics as a thermometer for IT business. Teams that know how to analyze metrics work well. After all, they do not just treat the site, but see the cause of the disease, and weak points. That is why analysis and monitoring is an important stage for the success of the project.